Visual Explanation of Python Panda Library
If you’ve gone through the visual explanation of Numpy Library, there is one thing common in Numpy and panda that they both are used to store data and perform operations on that data.
For a quick difference, remember Numpy as a group of lists or multi-dimensional arrays whereas remember Panda as a table. We call those tables, Data Frame.
Pandas offer 2 data structures;
- Series (one-dimensional)
- DataFrame (two-dimensional)
Each column in a data frame is a series. You can consider a data-frame as a database table where we can query data just like SQL.
- NumPy: Use NumPy when you need to perform numerical computations, especially with arrays or matrices. It’s ideal for mathematical operations, linear algebra, and scientific computing.
- Pandas: Use Pandas when working with structured or tabular data. If you need to manipulate, clean, analyze, or visualize data stored in tables or CSV files, Pandas is the go-to library.
install
pip install pandas
import
1
import pandas as pd
Contents Sharing Conditions
All the images and contents used in this article are meant to be used on Solothought.com only. You can use it to make your personal note. But publishing it on any site, blog, video or other medium without a link to this site or article is prohibited.
Things to learn You can majorly divide your learning in 4 parts
- Build Data frame: either in code itself or from some external file like Excel, CSV etc. Adding or deleting rows or columns.
- Selection of data: Select a particular row or column, or a range. Group by data etc.
- Operation on data: Like aggregation, Handling NA values etc.
- Save Dataframe to a file: for future use.
For this tutorial, I’ve created a Jupiter notebook for direct practice. So download it on your local or test it online while you’re going through this article. All the images in this tutorial are self explanatory. So I’ll not explain much. However, if there is something that you find incorrect, confusing or unclear then leave me a message on the discussion forum.
First, you need to read the data and build a dataframe.
1
2
3
4
blog = pd.read_csv("blog.csv")
opensource = pd.read_csv("opensource.csv")
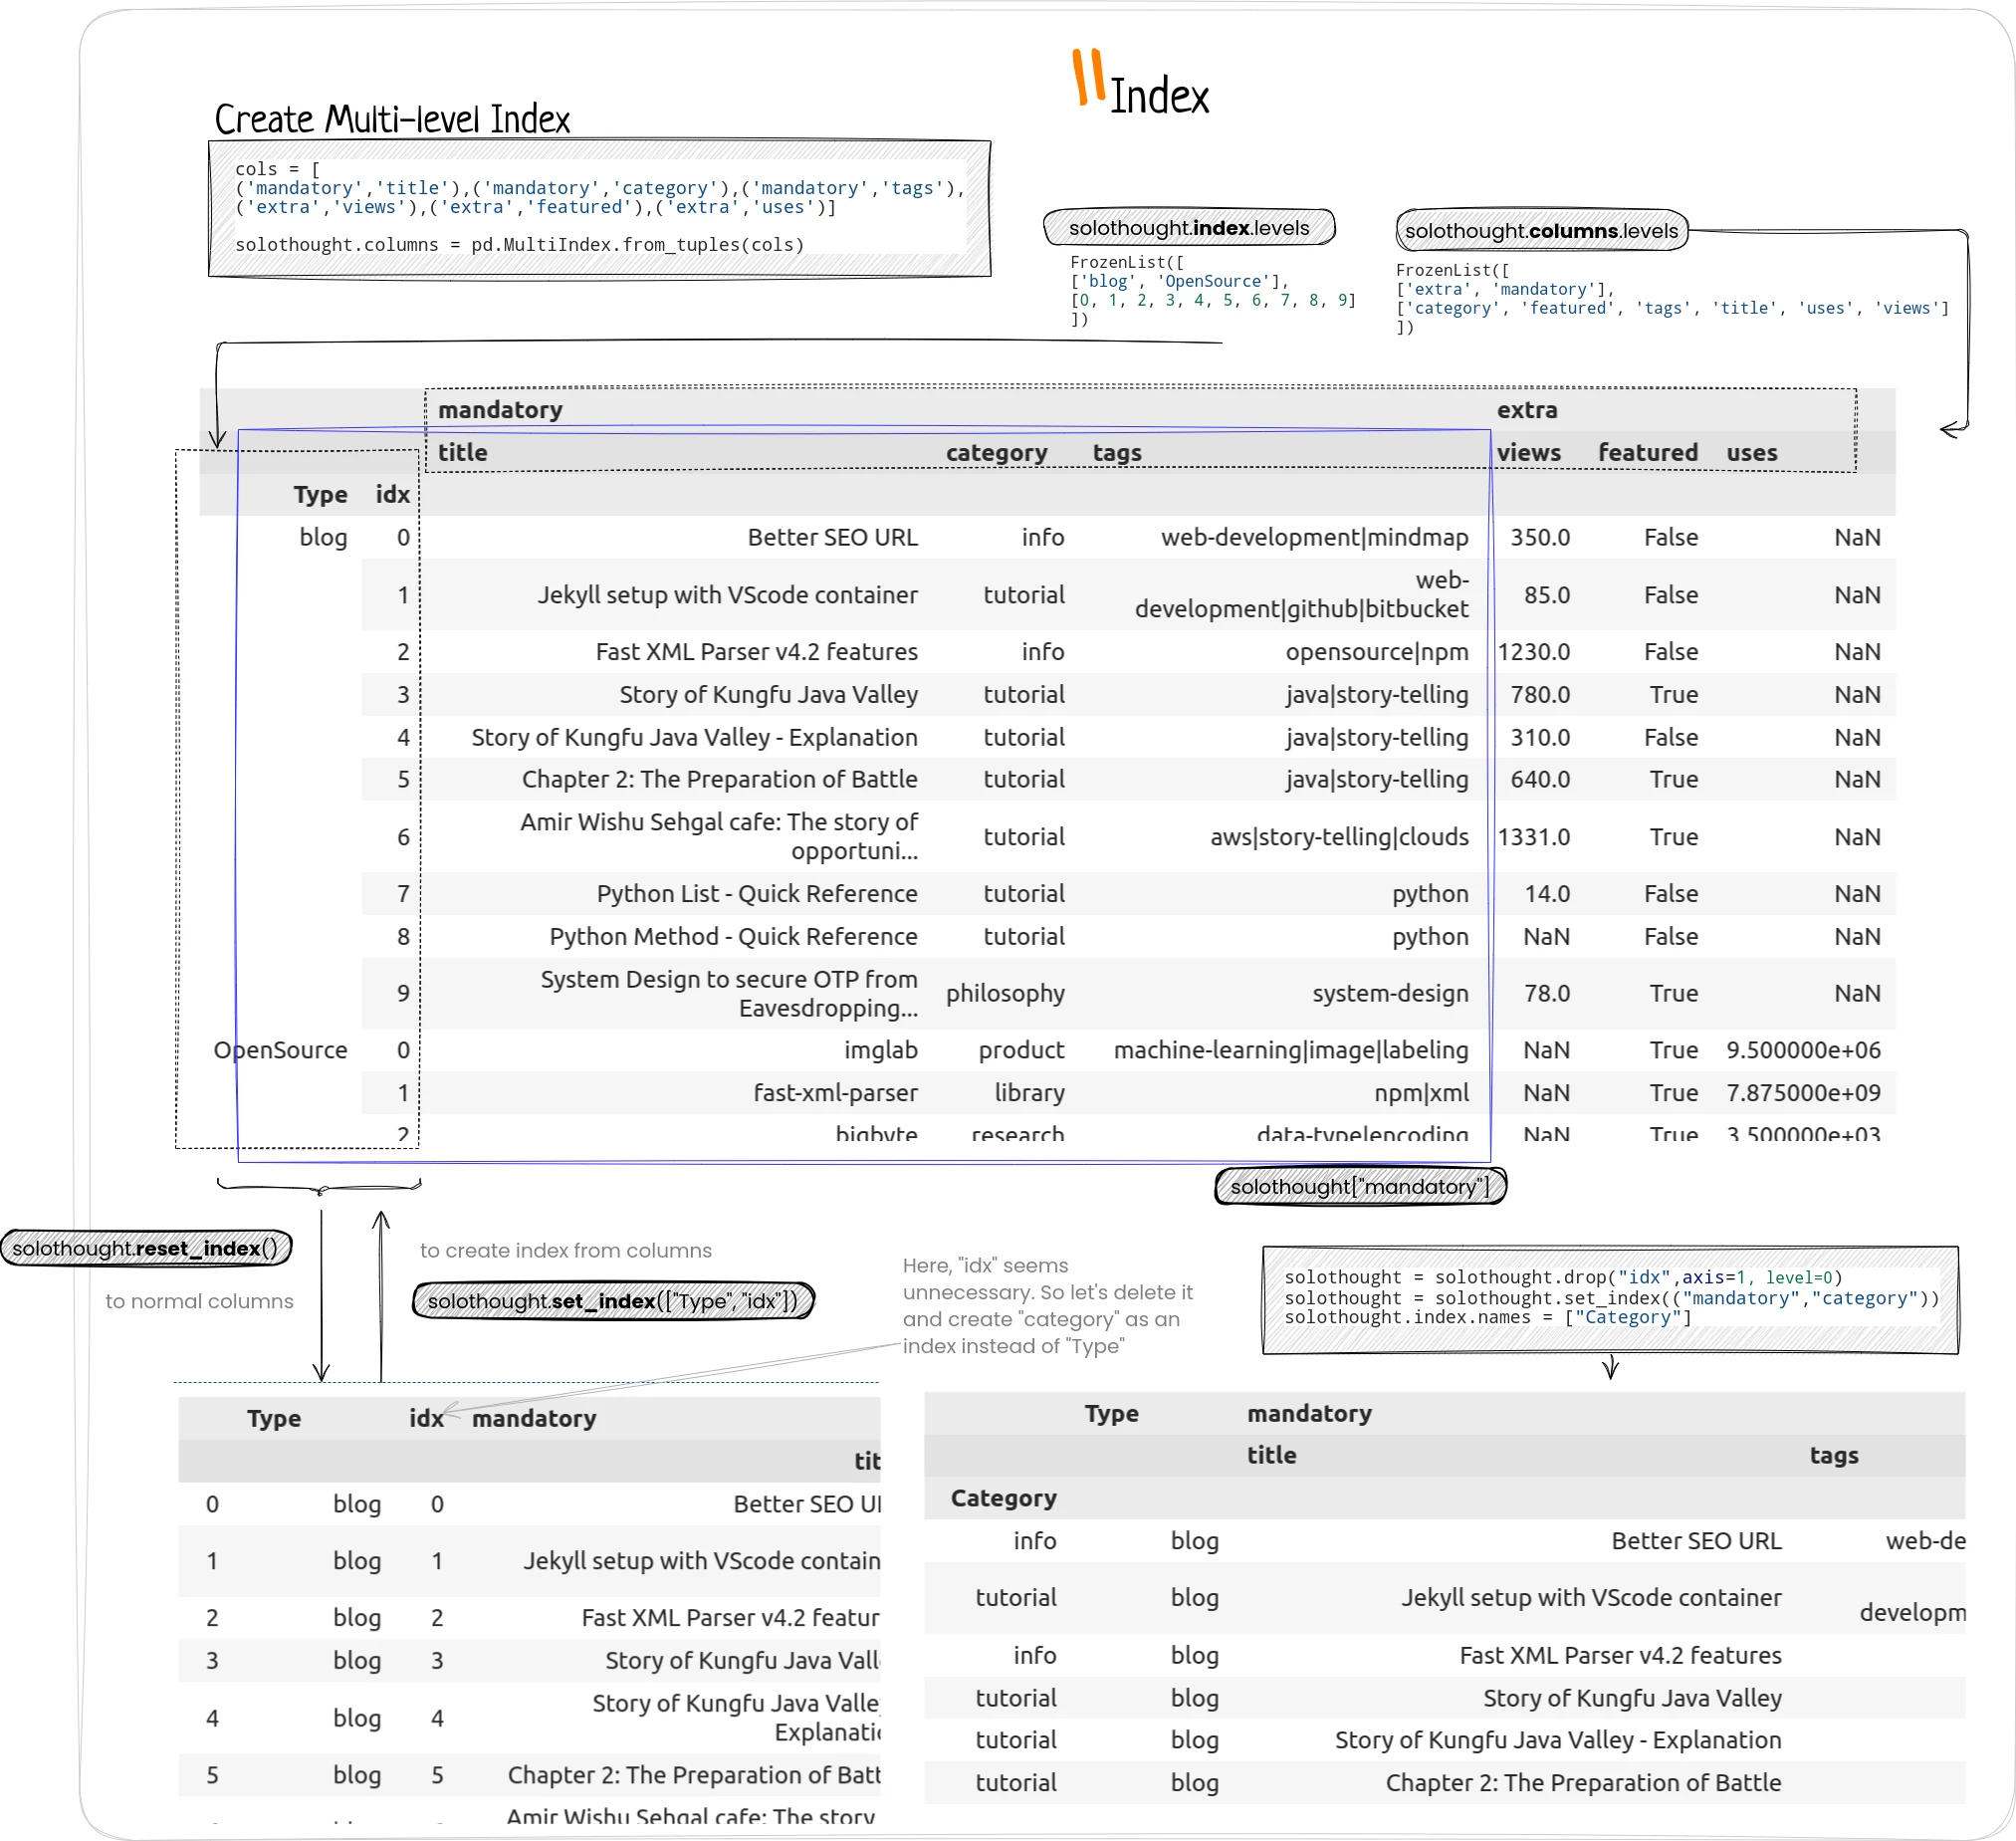
solothought = pd.concat([blog,opensource],keys=['blog','OpenSource'],names=['Type','idx'])
# st = solothought
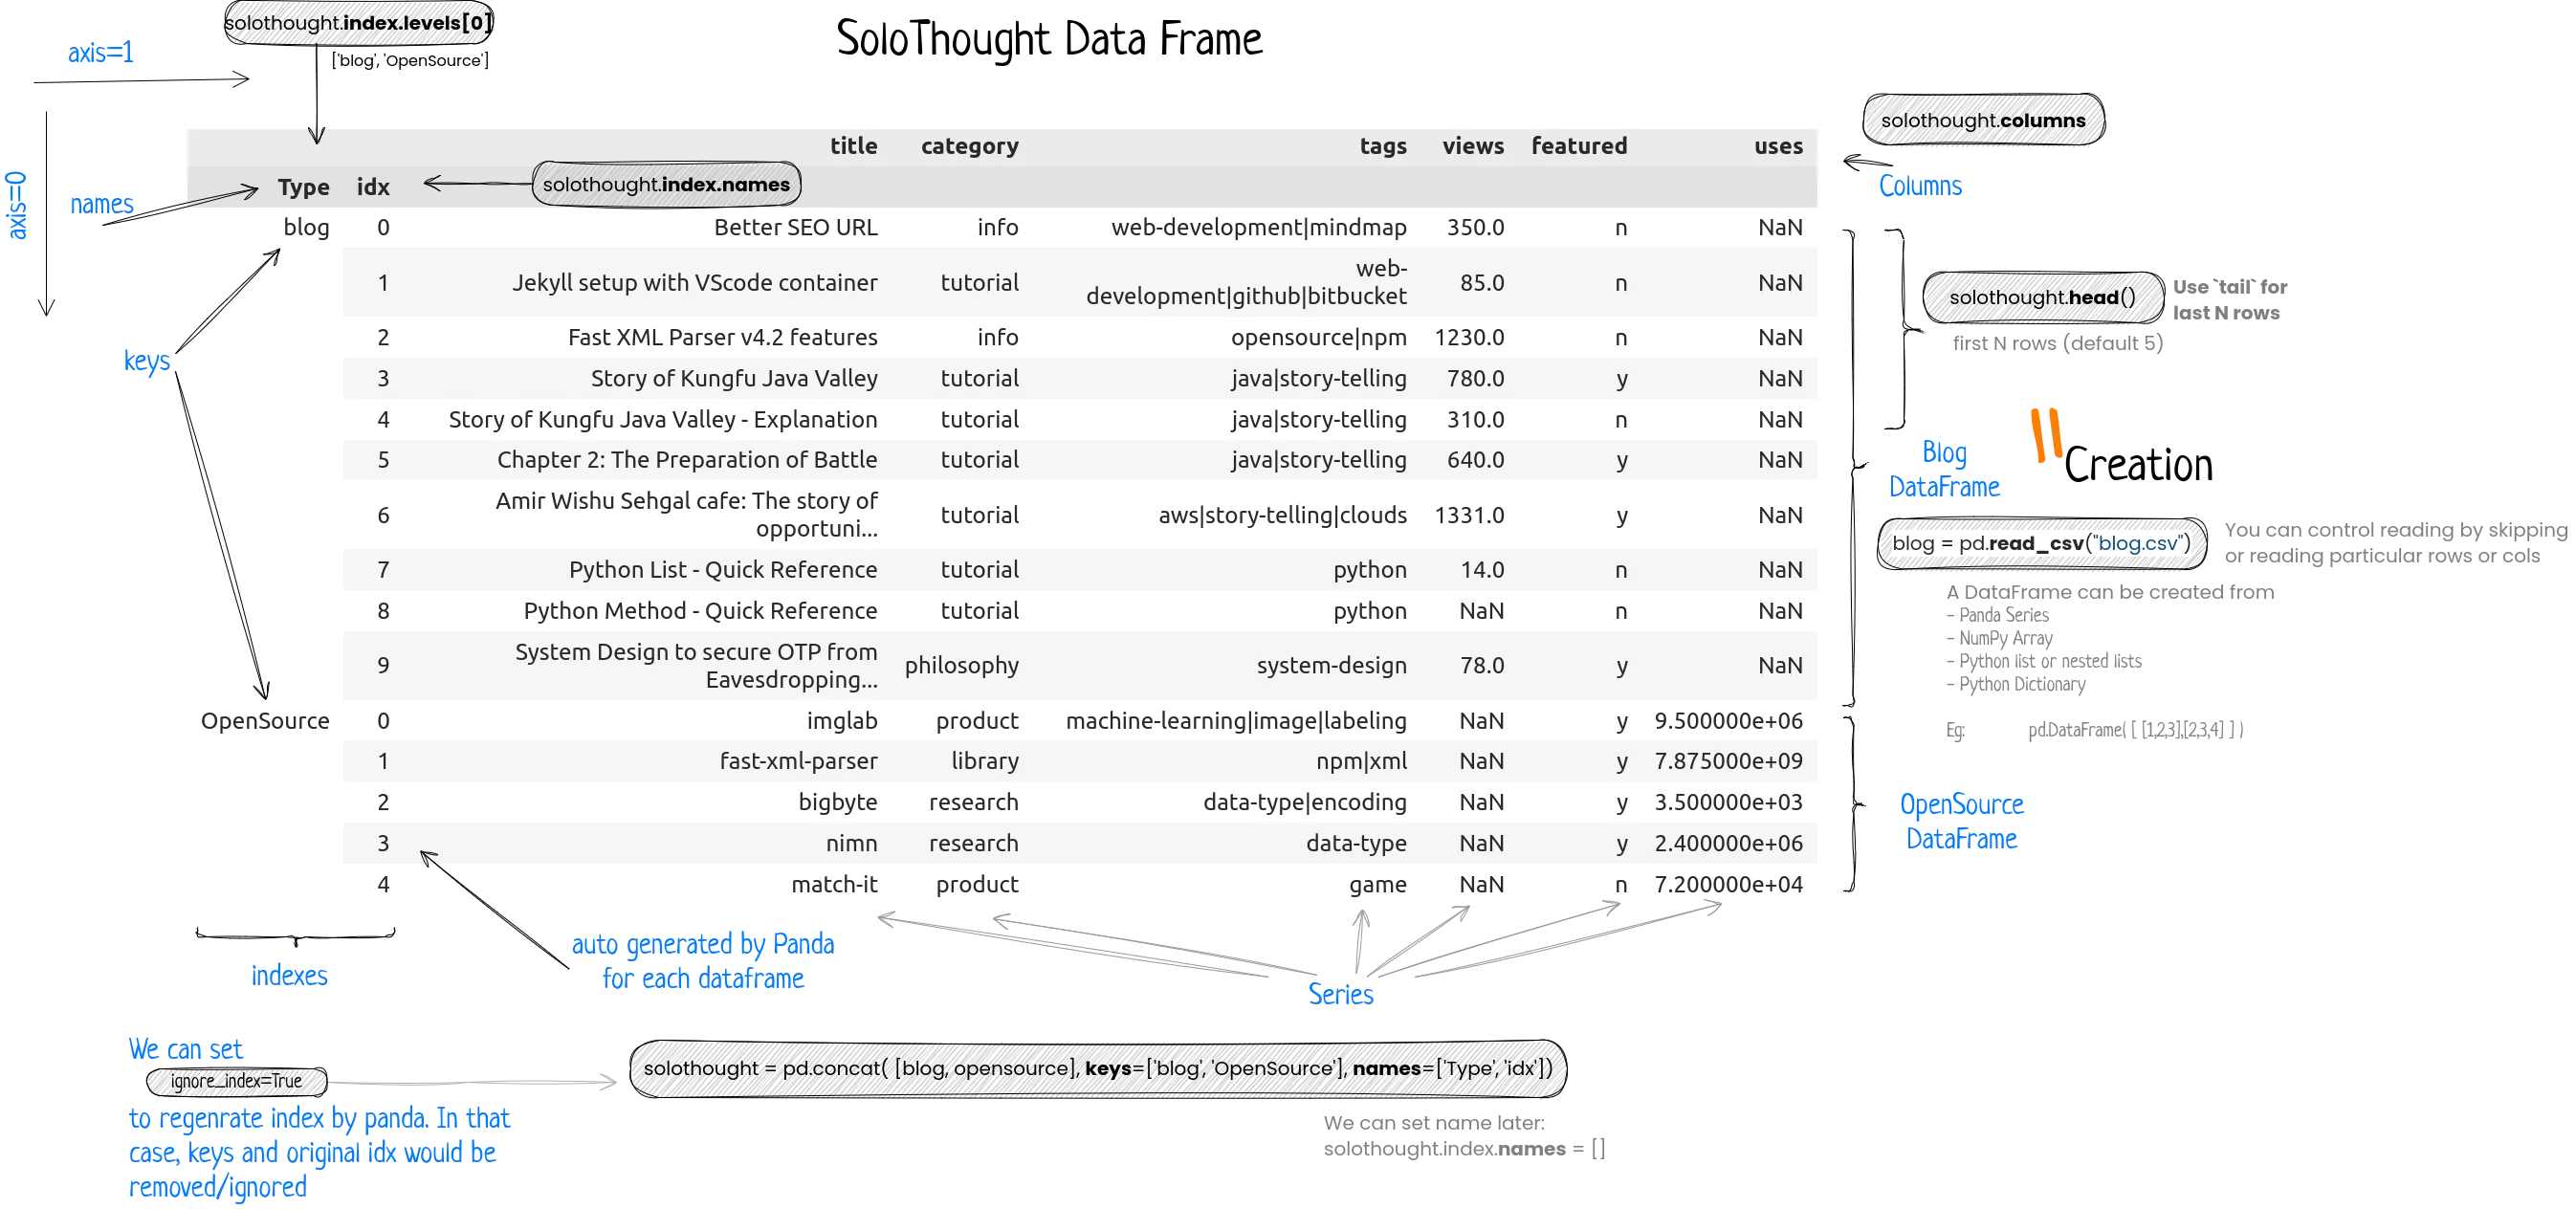
In the above diagram, I’ve tried to explain different parts of a dataframe. This is the same datafram, we’ll be using in our Jupyter notebook and throughout this tutorial. So understand it before scrolling down.

Fetch some records
1
2
3
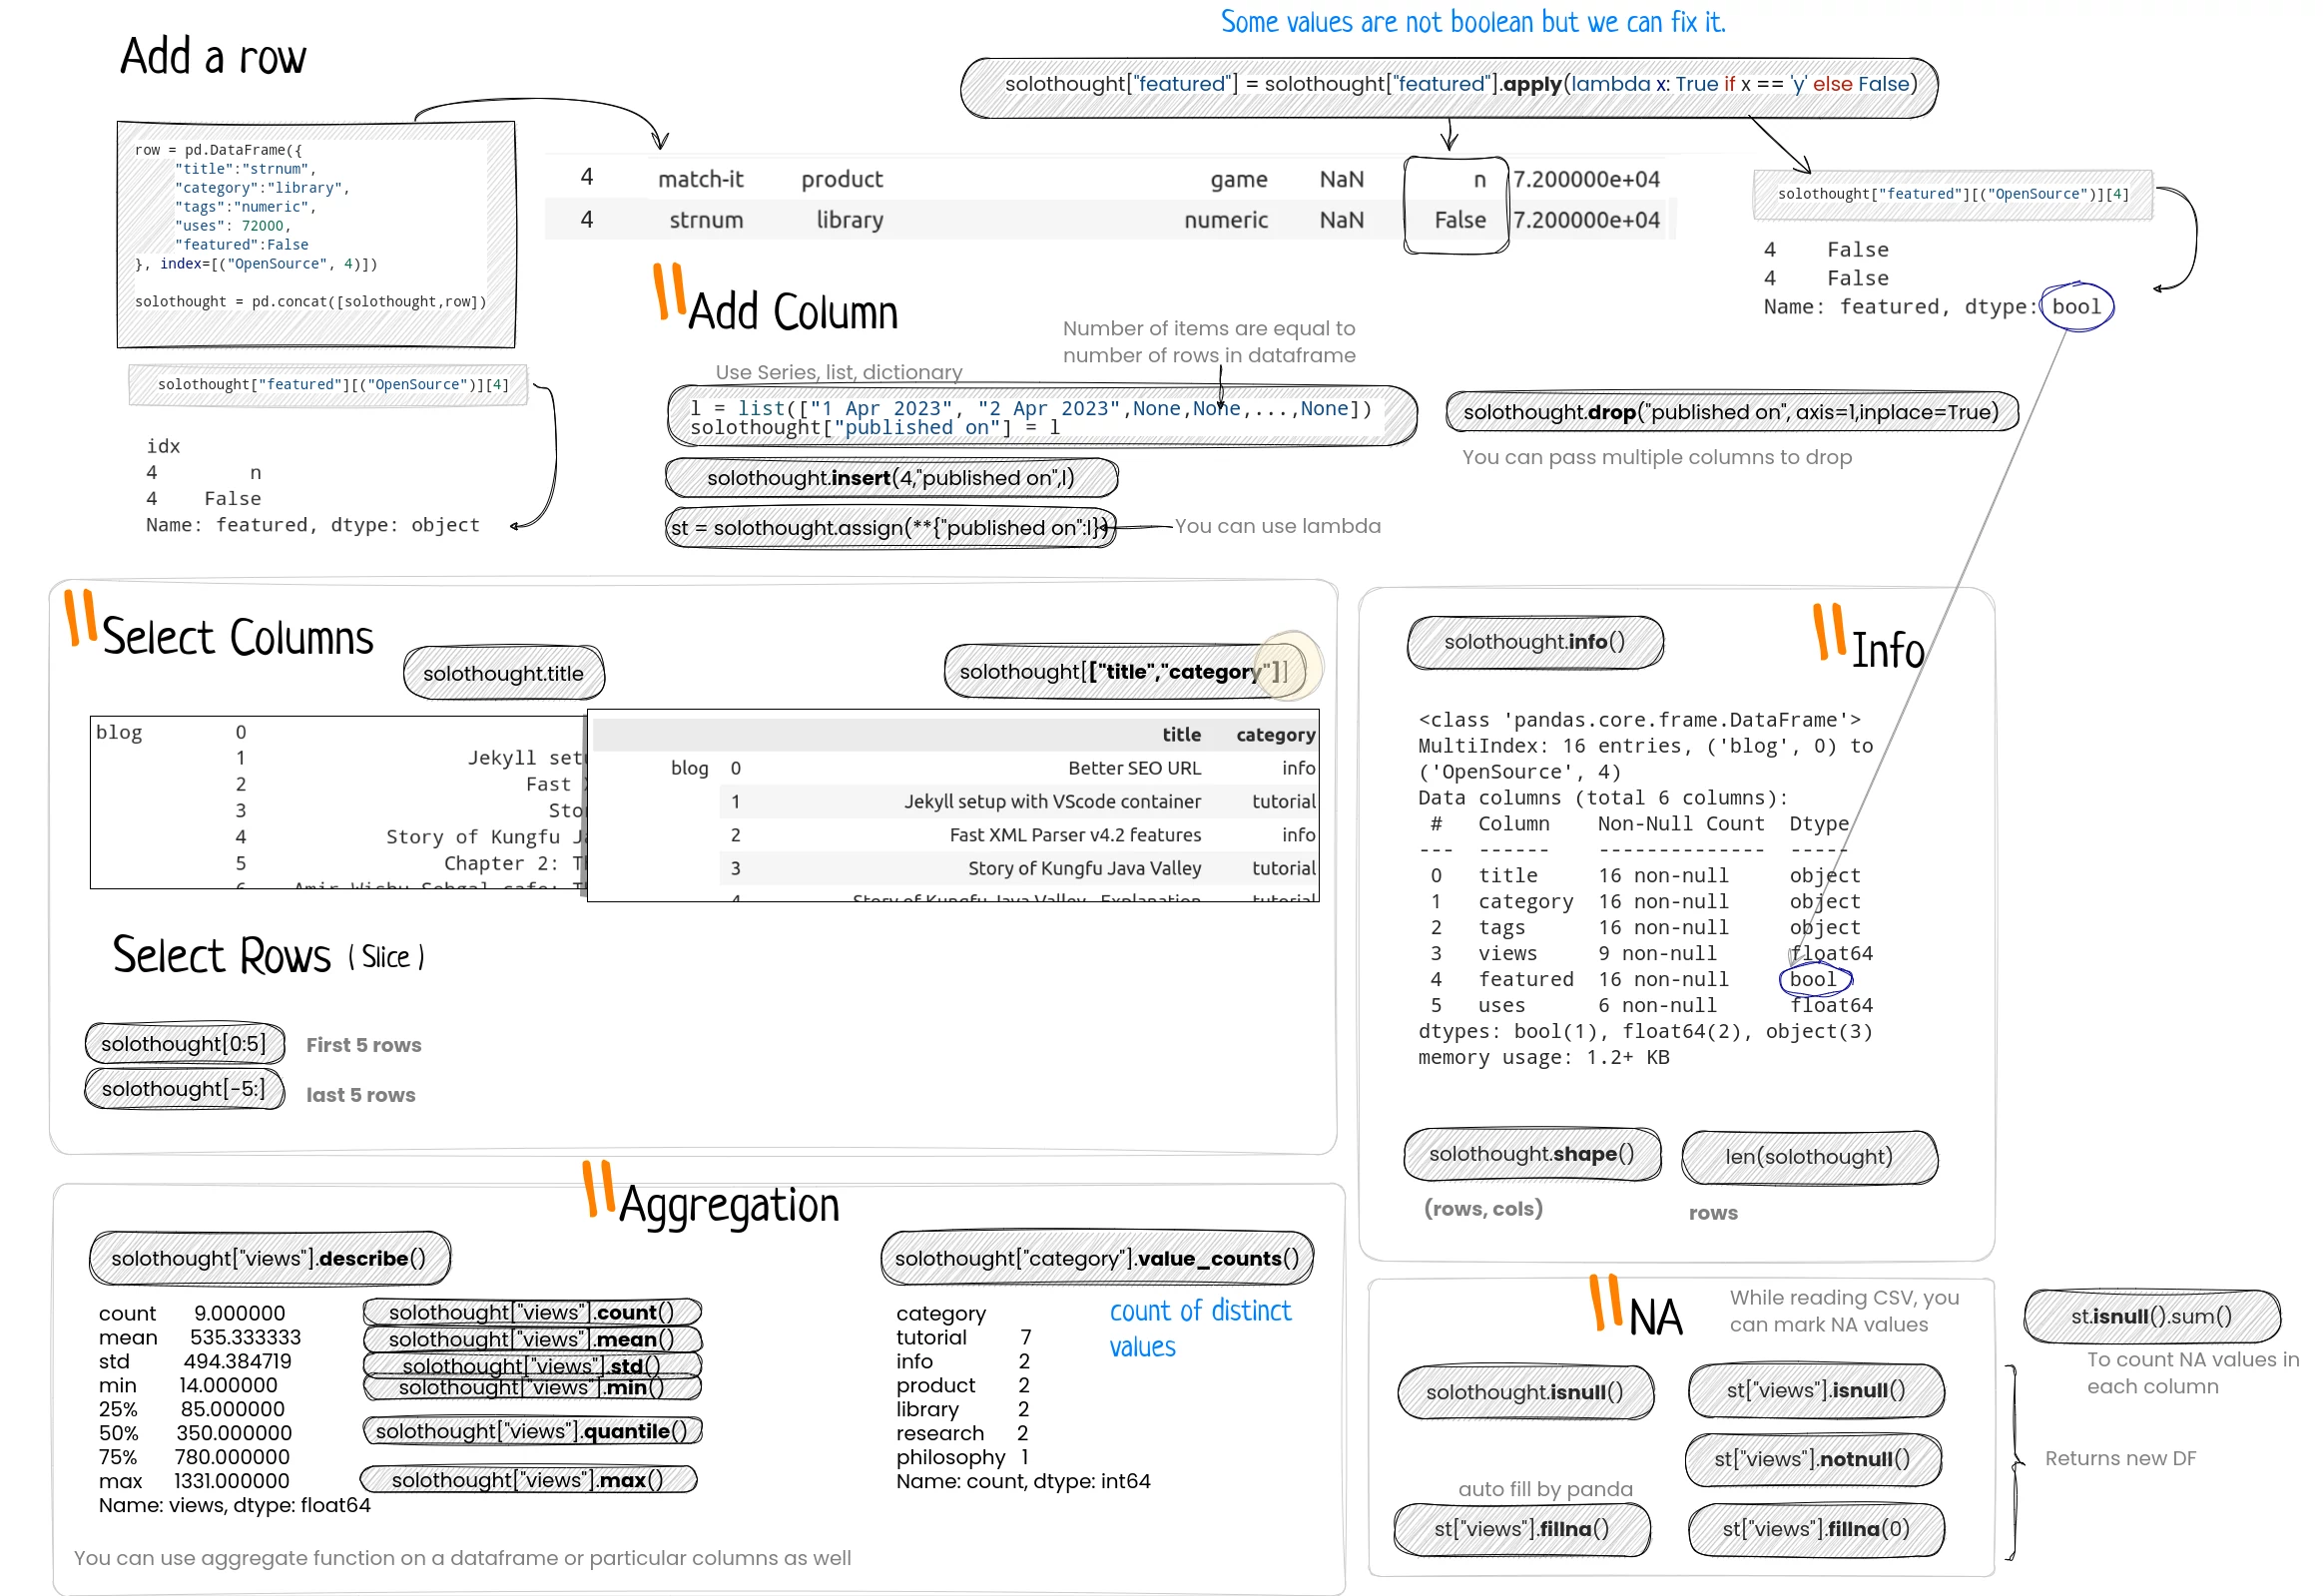
solothought.head() #first 5 records
solothought.sample(5,weights="views") #any 5 records
solothought.tail() #last 5 records
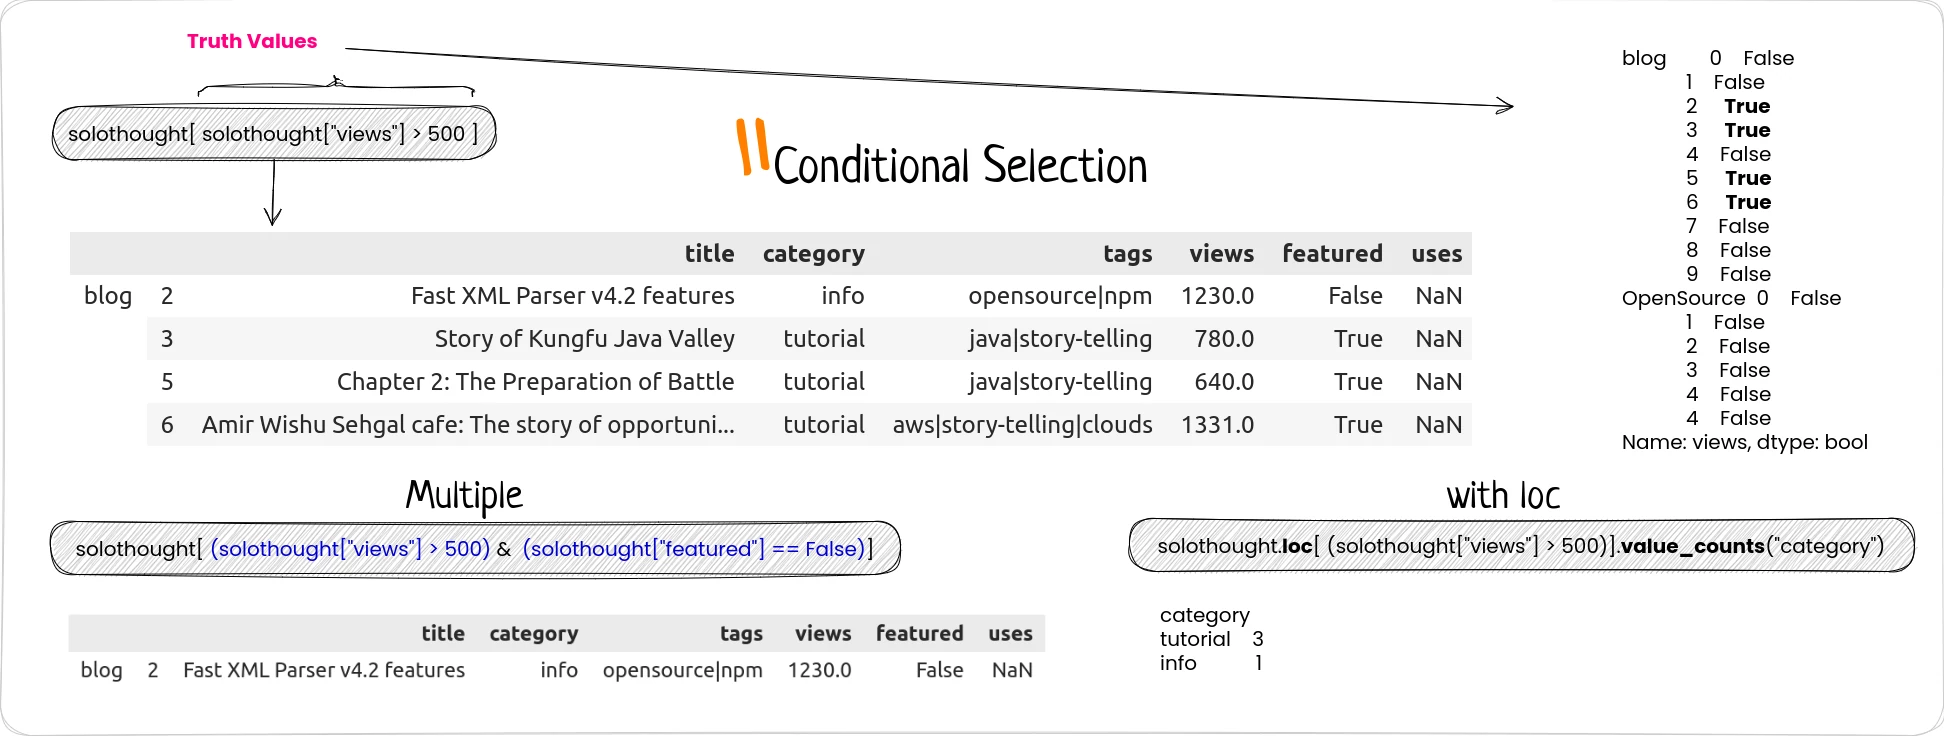
Use apply or map function to perform any operation on each value of a column or row. In our sample data, we’ve a column where boolean values are stored as ‘n’ and ‘y’. So we’ll convert them in proper boolean values.
1
2
# convert to boolean
solothought["featured"] = solothought["featured"].apply(lambda x: True if x == 'y' else False)
You can add a row by concatenating another dataframe. And a column can be added directly like solothought["published on"] = <Series|list> in last in the same way we replaced solothought["featured"] above with a new list. You can insert a column at a particular position as well. Use drop to drop a column. Don’t forget to specify axis. We’ll learn more about it when we know how to select.
1
2
3
4
5
6
l = list(["1 Apr 2023", "2 Apr 2023",None,None,...,None])
solothought["published on"] = l
# or
solothought.insert(4,"published on",l)
# or
st = solothought.assign(**{"published on":l})
Note that, there are many methods in pandas which return a new dataframe instead of updating the used one. So either you need to set
inplace=Truemethod parameter or assign to the data-frame.
Don’t be confused between null and na. NA means not available values. You can define a set of values which should be treated as NA values while reading the CSV file. It is quite important to fill NA values before analysis.
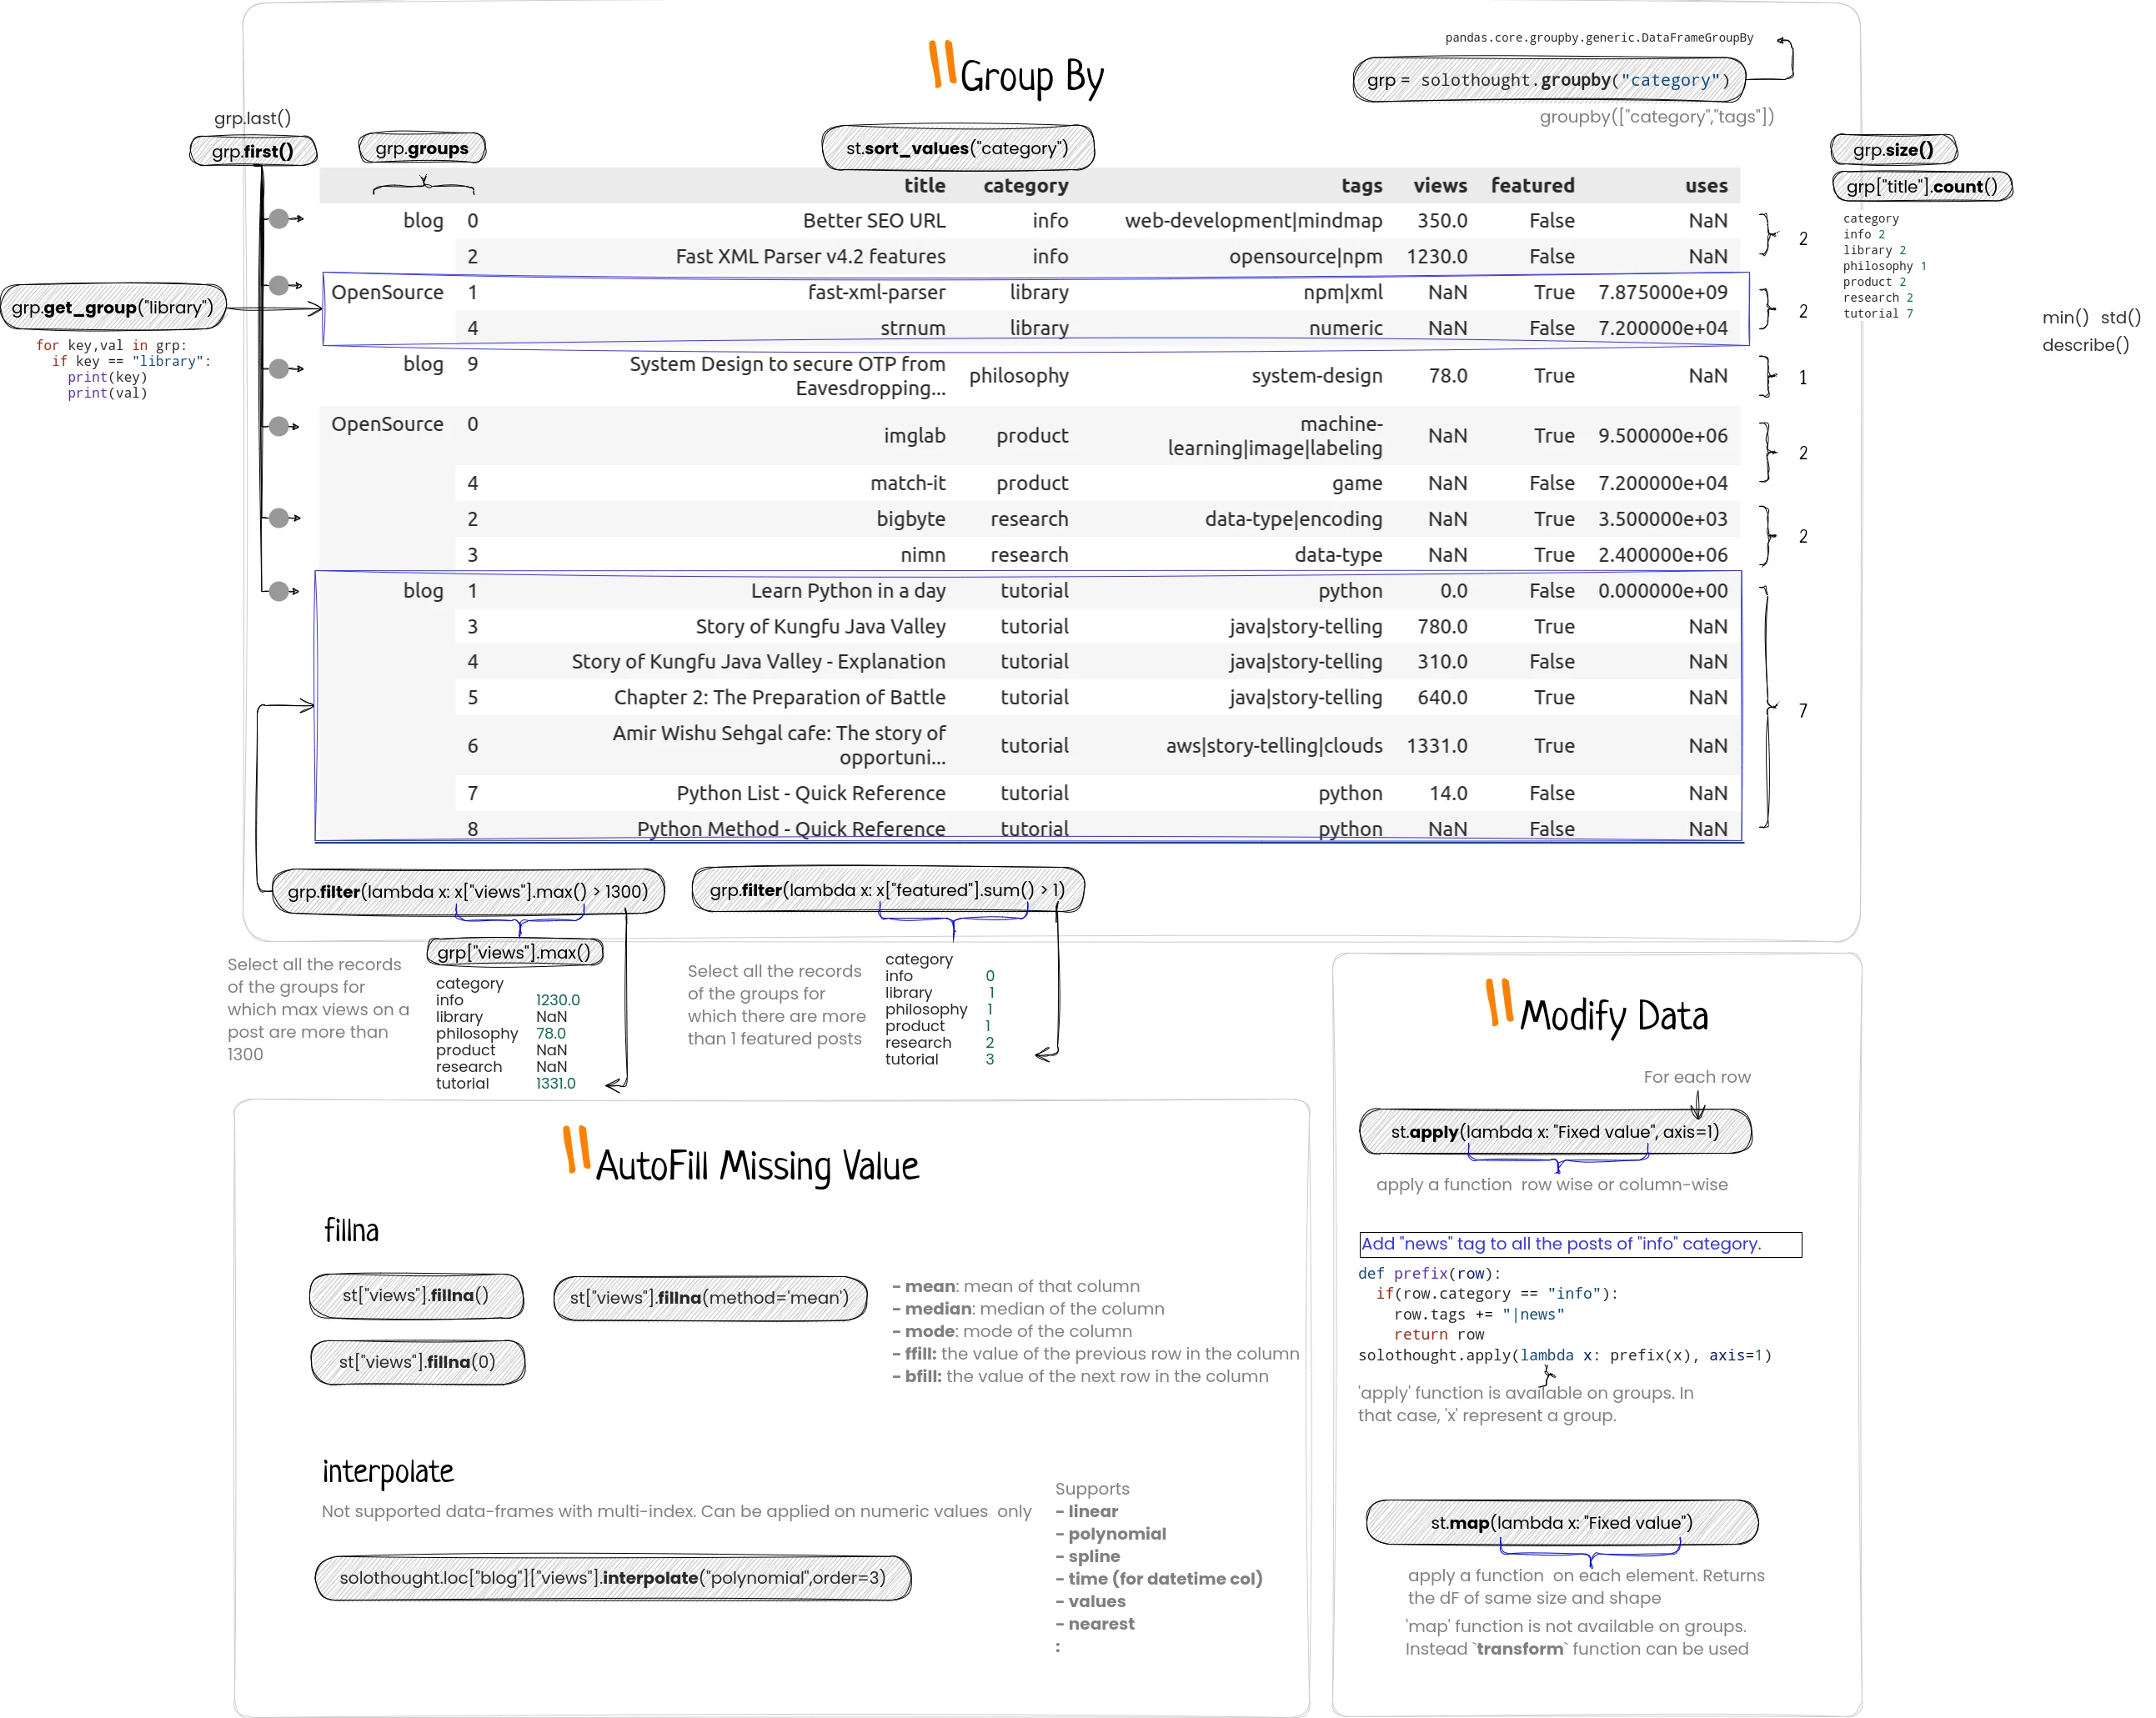
GroupBy operation confuses many. So let me explain that with a simple example;
1
2
3
4
5
6
7
8
9
10
11
12
13
14
import pandas as pd

# Creating lists for each column
c1 = ['A', 'A', 'A', 'A', 'B', 'B', 'B', 'B']
c2 = ['a', 'a', 'b', 'b', 'a', 'a', 'b', 'b']
c3 = [1, 2, 1, 2, 1, 2, 1, 2]

# Creating the DataFrame
data = {'c1': c1, 'c2': c2, 'c3': c3}
df = pd.DataFrame(data)

# Displaying the DataFrame
print(df)
Output
1
2
3
4
5
6
7
8
9
  c1 c2  c3
0  A  a   1
1  A  a   2
2  A  b   1
3  A  b   2
4  B  a   1
5  B  a   2
6  B  b   1
7  B  b   2
If we group by above dataframe using c1 column then it’ll form 2 groups.And each group will have 4 rows.
1
2
grp = df.groupby("c1")
grp.count()
Output
1
2
3
4
	c2	c3
c1
A	4	4
B	4	4
But if we group by c1 and c2 both then it’ll form 4 groups; (A,a), (A,b), (B,a), (B,b). And each group will have 2 rows.
1
2
3
4
5
6
		c3
c1	c2
A	a	2
        b	2
B	a	2
        b	2
Once you form groups using group-by operation, you can perform aggregate operation on a column that would be performed group wise. So the number of rows in output would be equal to number of groups you have.
1
2
grp = df.groupby(["c1"])
grp.sum("c3")
1
2
3
4
	c3
c1
A	6
B	6
We’ll some more examples later in this article.
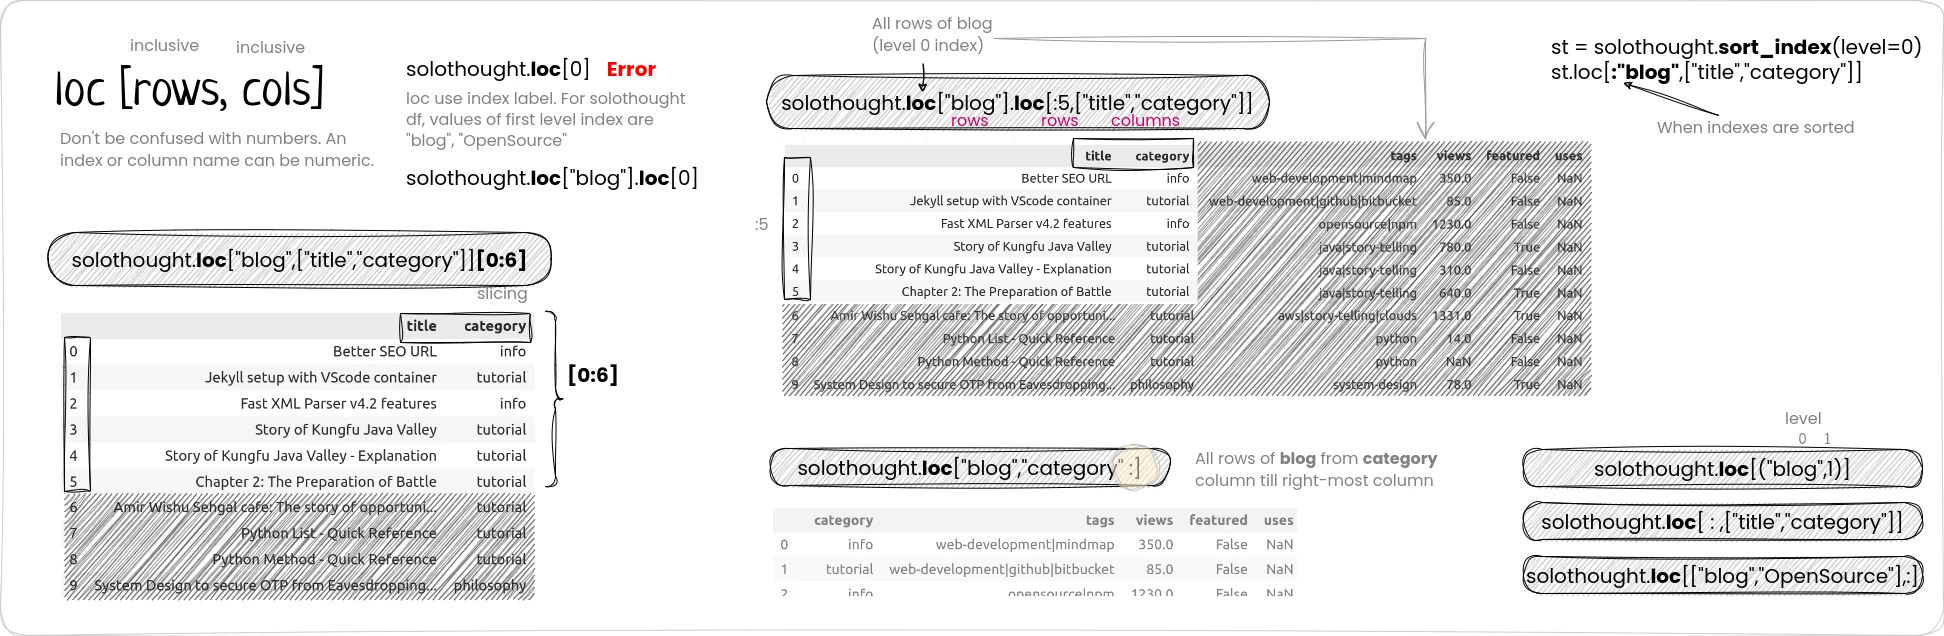
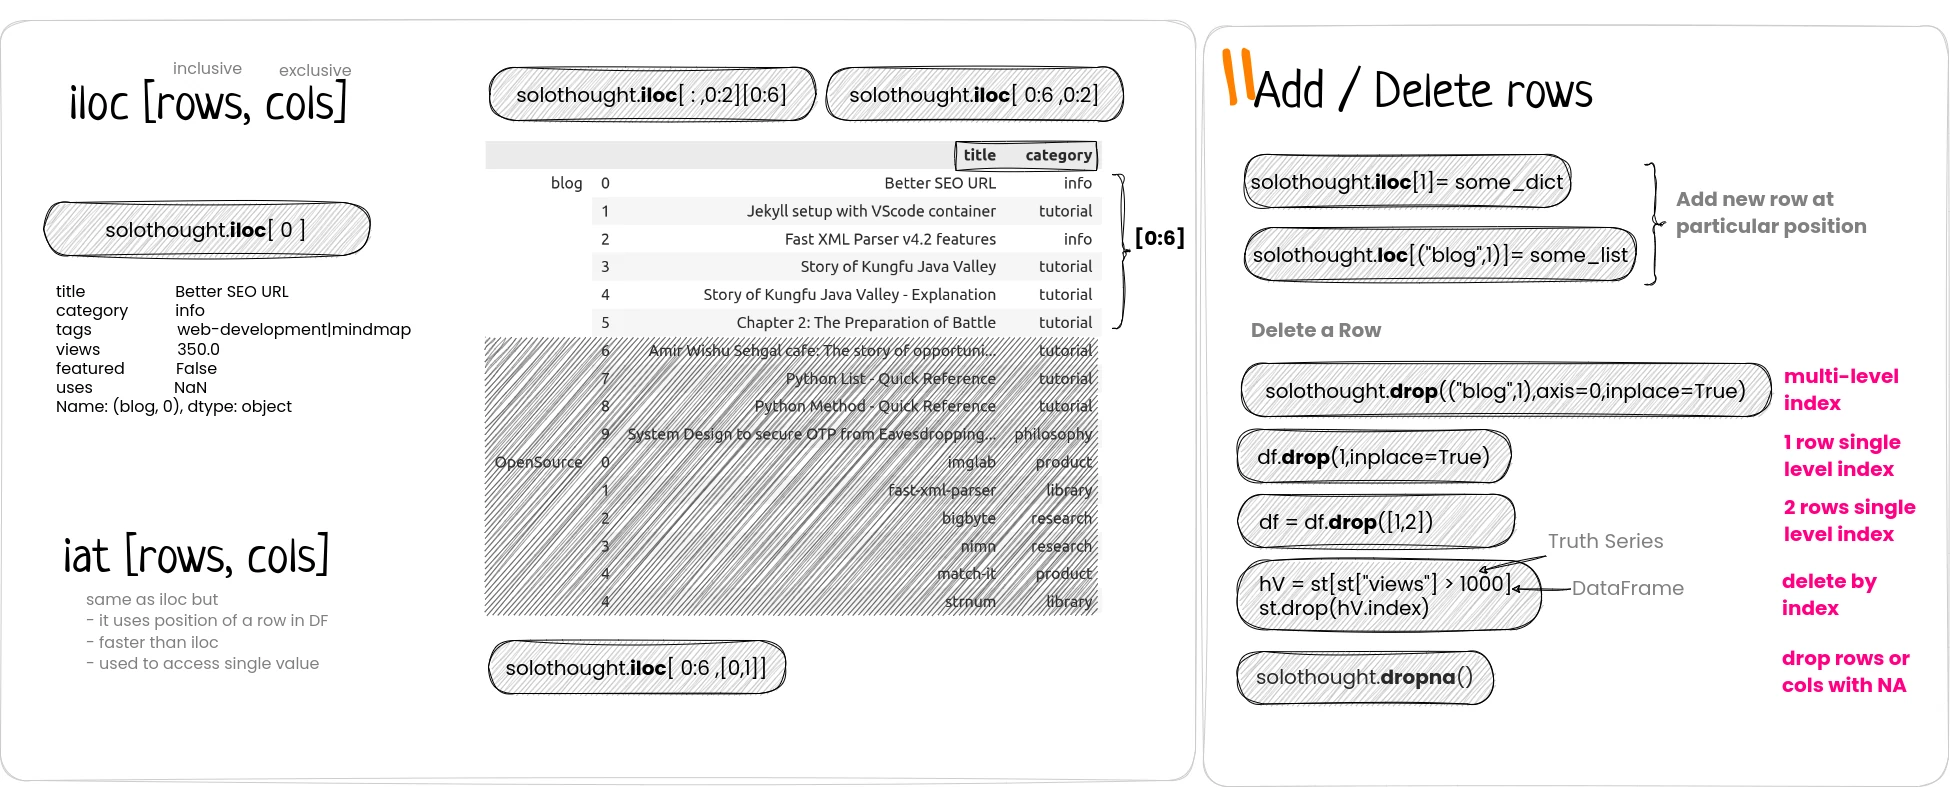
You can select a row or set of rows or just the columns or particular value using proper index directly, or with loc or iloc methods.
When dropna
- Use axis to drop col or row
- Use how to drop if all values are NA or at least 1
- Use thresh to check min NA before drop.
- Use subset to set cols where to check NA values
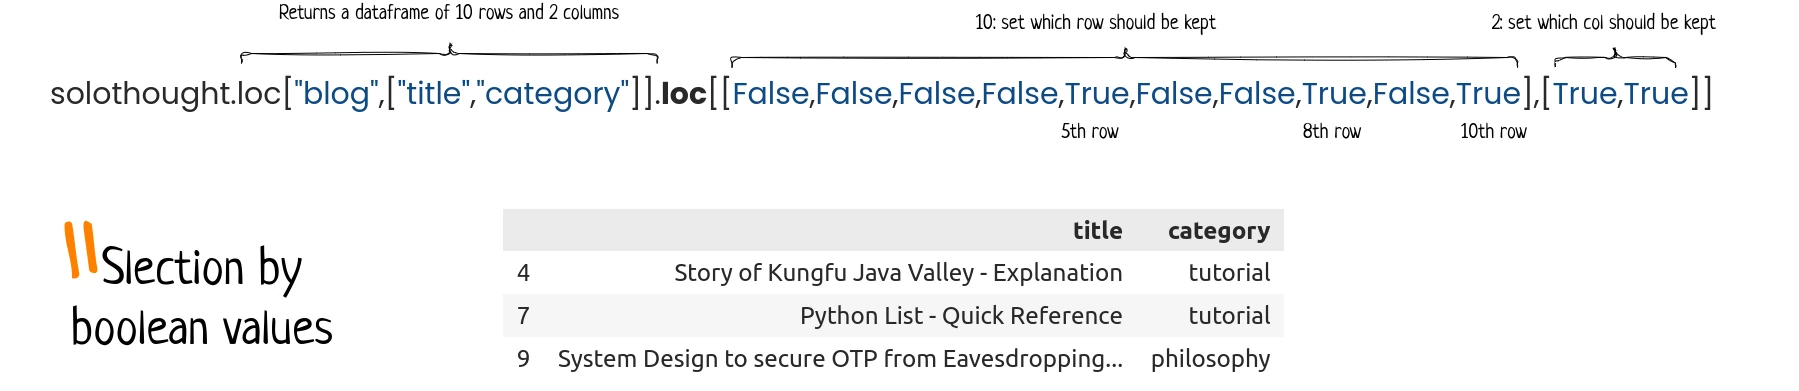
You can even pass a list of Truth vallues to select rows and columns
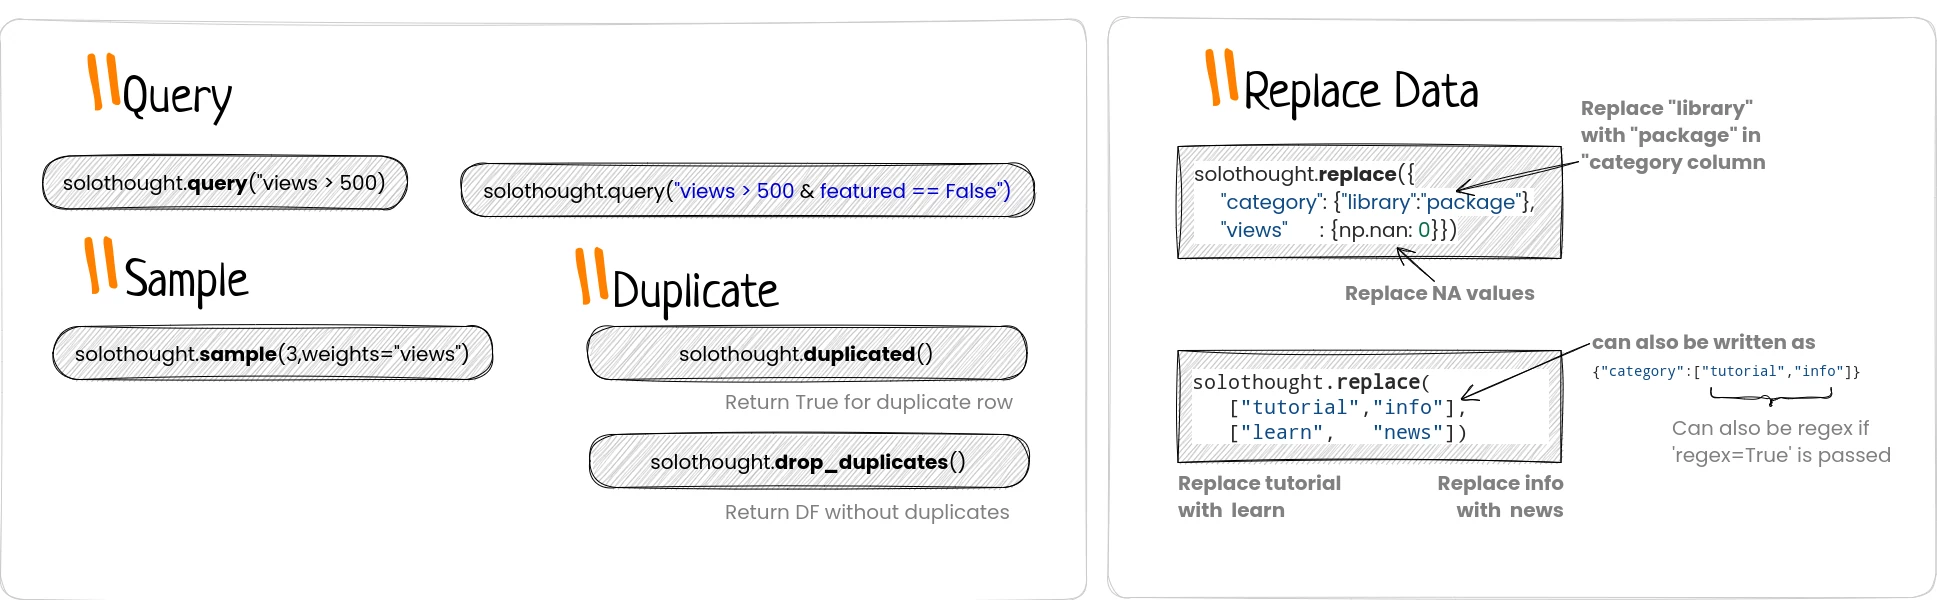
But there is a better and fast alternate: query.
Your feedback is really important. So I can improve my future articles and correct what I have already published. You can also suggest if you want me to write an article on particular topic. If you really like this blog, or article, please share with others. That's the only way I can buy time to write more articles.
